Other
Some other available functionality is described here.
Show Graph
Once a composite process or an intermediate composition is created, its graph can be viewed on a separate window.
- This can be accomplished by right-clicking the composition and selecting the

Show Graphoption. - The full graph is also shown when hovering above the blue process box of a (collapsed) composite process.
This can be particularly useful for composite processes which appear as a single atomic process in subsequent compositions.
Load Compositions
In some cases it may be useful to reload the intermediate (binary) composition steps that we followed when a composite process was stored.
- This can be accomplished by right-clicking a composite process and selecting the

Load Compositionsoption.
This will create a new workspace and add all the composition steps used to create the selected process as intermediate compositions.
This can be particularly useful for example when a composite process has become invalid due to an updated component and you need to adjust the composition actions, or if a similar copy of the same composition is required, but the workspace no longer exists.
Inspect π-calculus
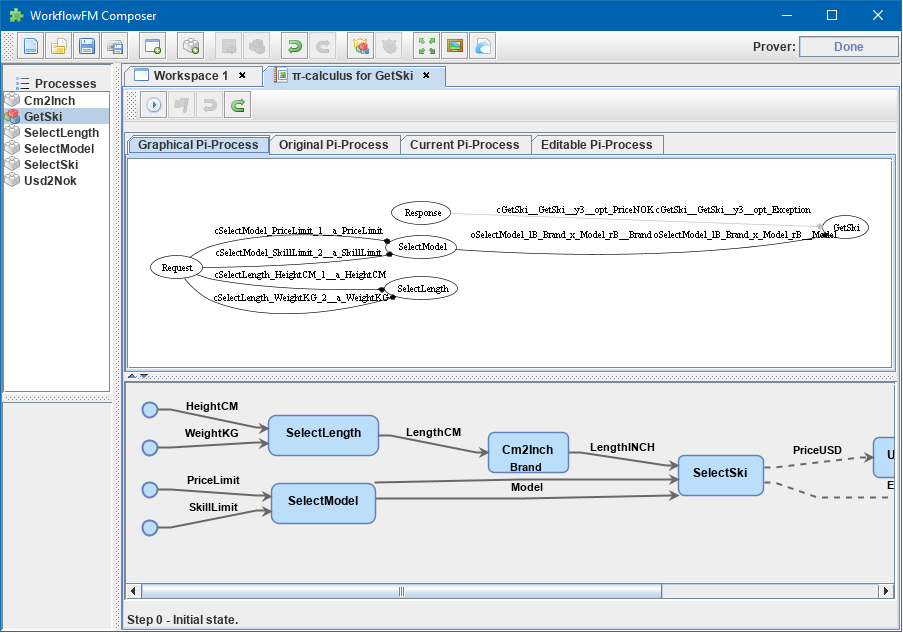
The reasoner automatically produces π-calculus specifications of the specified processes. These can be visualized and inspected using the PiVizTool, which has been directly integrated with the Client.
dot executable must be available in the PATH for it to function.- This can be accomplished by right-clicking the composition and selecting the

Inspect pi-calculusoption.
The graph includes a Request and a Response process, which are responsible for the sending the initial inputs and receiving the final outputs respectively.
Using the Ski example, the PiVizTool window is shown below:

The visualization is interactive. Resources are communicated between processes by clicking on black edges or using the icons at the top.
Some familiarity with π-calculus is required to be able to follow the execution steps.